
This is an analysis of the image resizing algorithms used by popular web browsers. It was made with the help of my ResampleScope utility.
These tests were done years ago, and new versions of these browsers quite possibly work differently. This page should be thought of as a demonstration of how to use ResampleScope, and not as an evaluation of web browsers.
In the pictures below, the blue graph is the one you should be looking at. The red graph is for reference; it’s what I think the web browser was trying for. Ideally, the red graph (when present) will be almost entirely obscured by the blue graph. The reference graphs were made with the help of my ImageWorsener utility (hence the “iw” prefix).
All testing was done on Microsoft Windows 7 or Windows XP. A web browser’s resizing behavior might be different on other platforms, or might be affected by any number of factors unknown to me. Anything on this page could be wrong.
Upscaling:

Firefox 7 uses linear interpolation, which when upscaling is the same as a triangle filter.
Downscaling:

When downscaling just slightly (from 557 to 555 pixels), we get the above picture. This could be any of at least three different algorithms, so we need to also look at larger scaling factors.

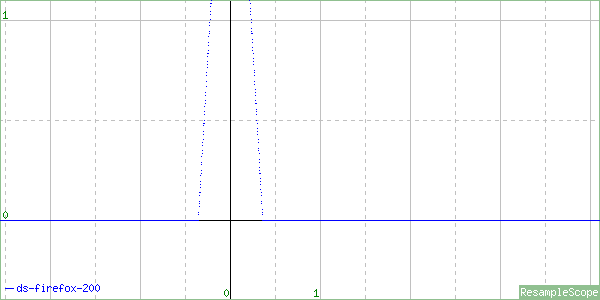
Based on this and other evidence, Firefox 7 uses simple linear interpolation, even when downscaling. This is a very poor downscaling algorithm, which for large scaling factors is no better than a nearest-neighbor algorithm. It’s very fast, though.
Note: Firefox 20 may support multiple scaling algorithms, which can be selected using CSS styles. This page only examines the default algorithm.
Upscaling:

Firefox 20 uses linear interpolation when upscaling. It’s not implemented exactly the same as it was in Firefox 7.
Downscaling:
Firefox 20 supports high quality downscaling, but for some reason it doesn’t work if another instance of the same image appears on the same web page. So, it doesn’t work with ResampleScope’s test page.

When high quality downscaling does work, the image quality is good. It uses a 3-lobed Lanczos filter, which appears to be accurately implemented.

Upscaling:
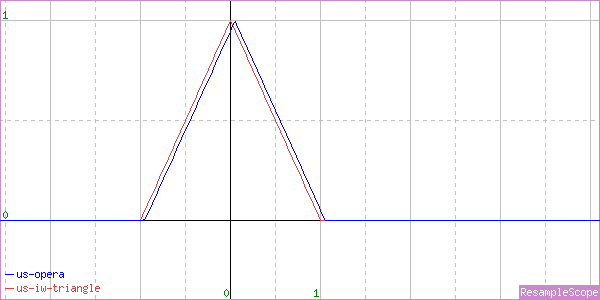
Like Firefox, Opera uses linear interpolation when upscaling. It shifts the image slightly to the right.
Downscaling:

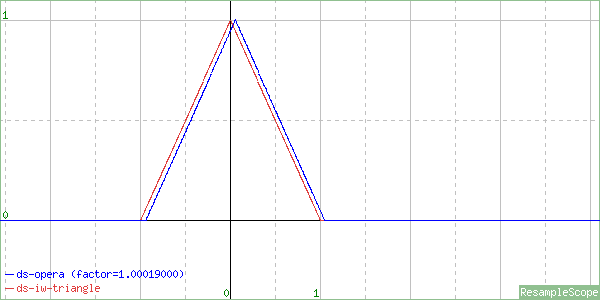
It also uses simple linear interpolation when downscaling. But there’s a(nother) problem here. Opera resized the image from 557 to 555 pixels, so ResampleScope assumed it would resize the image features by the same factor: 555/557. But it didn’t do that; it apparently made the features a tiny bit larger, which caused ResampleScope’s analysis to get out of sync.
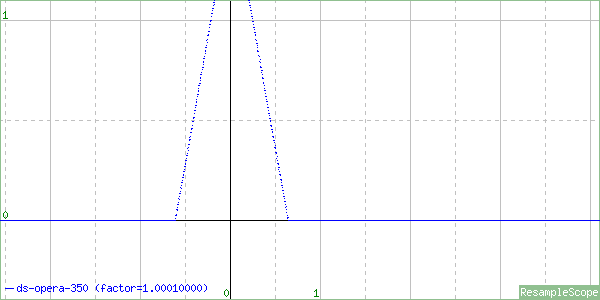
We can work around this by telling ResampleScope the scaling factor directly (with the -sf option), or by giving it a “fudge factor” (with the -ff option). By experimentation, I found that a fudge factor of 1.00019 works well enough. I don’t know what Opera’s overall logic is.
With “-ff 1.00019”:

Upscaling:
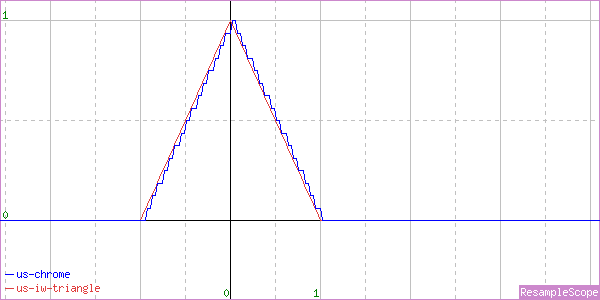
Google Chrome uses low-resolution linear interpolation, probably optimized for speed. It has a slight bias that shifts the image to the right.
Downscaling:

With a very slight downscale (557 to 555 pixels), Chrome uses the same linear interpolation as when upscaling. (The fact that this graph is disconnected is an artifact of the way ResampleScope works, and has nothing to do with Chrome.)
But look what happens if we downscale just a bit more, to 543 pixels:

We get a completely different result: clearly a 3-lobed Lanczos filter. Chrome’s strategy may be to use Lanczos when reducing an image by more than 2.5%.
If you look closely, you can see a small rightward bias. With a larger scale factor...


...the bias gets larger. Pay no attention to the fact that the graph is fuzzy. That’s an artifact of how ResampleScope works – it doesn’t work as well with large downscaling factors.
Upscaling:

When upscaling, Safari uses a low-resolution filter that could be an approximation of a Hermite filter. Nothing wrong with that.
Downscaling:

For very slight downscales (e.g. 557→555 pixels), it uses the same low resolution filter.
But reduce it by just one more pixel...

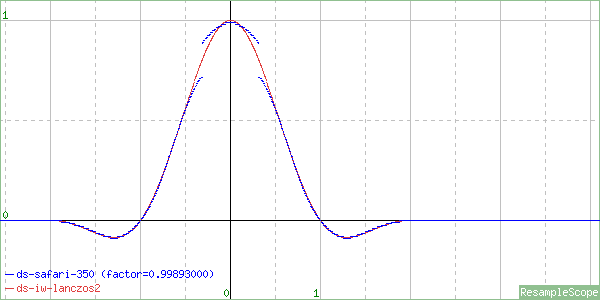
...and it uses a completely different algorithm. I can’t identify it. The gaps at −0.5 and 0.5 are unusual, and might be caused by post-processing used to sharpen the image. The rest of it is similar enough to a 2-lobed Lanczos filter that that’s what I’ve chosen to compare it to.
With a larger downscaling factor:

It’s not using the expected scaling factor. Trying again, with “-ff 0.99893”:
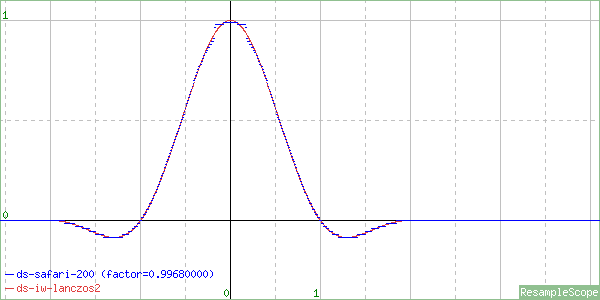
With an even larger factor, and “-ff 0.9968”:
Note: When testing Internet Explorer, I applied the CSS style “-ms-interpolation-mode:bicubic” to the images. That may have made a difference in some cases.
Upscaling:

The image is shifted left. There’s another problem, which this graph isn’t quite big enough to show, but which is easily visible in the image itself:

The light patch at the far right may be a wrap-around error that occurs at extremely large upscaling factors.
See the IE8 section for a discussion of what this filter might be.
Downscaling:
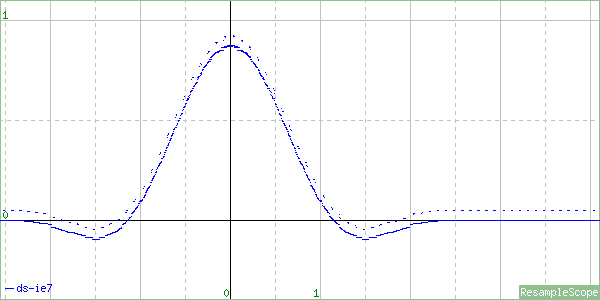
I don’t know the reason for the vertical echo here, but there are a number of things that could cause effects like this, such as solid colors being modified (which they shouldn’t be), or a dependence on row number, or some sort of post-processing.
Larger downscaling factors:


Upscaling:

IE8 fixed the bugs in the IE7’s implementation. But what algorithm is this? I just don’t know.
It’s very similar to Photoshop’s “Bicubic Smoother” algorithm, which uses a blurred cardinal cubic filter with C=0.625, and a blur factor of 1.15. It’s not exactly that, but it’s close enough that I suspect it’s not a coincidence.
Downscaling:
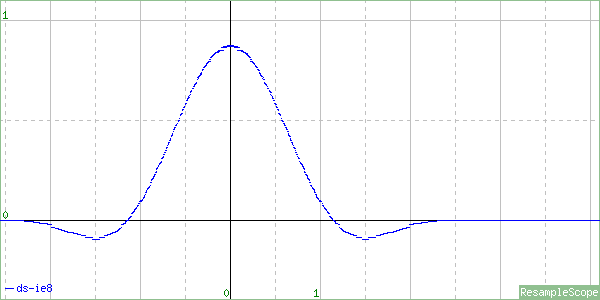
Slight downscales appear to use the same filter as upscales do. The “chopped up” look of this graph is normal when ResampleScope graphs blurry downscaling filters. It happens because the source image gets blurred vertically as well as horizontally, leading to many more opportunities for roundoff error when ResampleScope unblurs it.

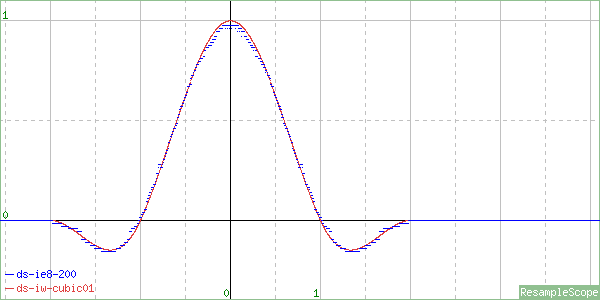
At larger downscaling factors, the filter used appears to get more similar to the cardinal cubic with C=1.0.
The scaling algorithms used by IE9 and above may depend on its configuration, and on your graphics drivers and hardware. More research is needed here.
This document is by Jason Summers.